Run reports
Users who are assigned Administrator roles can view all reports for other users on the account. Users who are assigned Agent roles can only view reports associated with their own login.
SetMe's reporting features allow you to track your team's connection activity, login history and productivity in order to make better data-driven decisions and improve overall performance. You may view the reports within the reporting dashboard and print/download them for further analysis.
To generate and view reports:
- Go to the Reports section of the SetMe portal and select a report type from the left-side navigation menu.
- Specify the reporting period (Date range), select the Users you want to include, then click Generate report. When generating a user performance report, you may also use the Data view filter to break the data output for each user by day, week or month.
You can access the following reports:
Console usage reports
Allow you to review the data for the selected users' console logins during a specific time period.
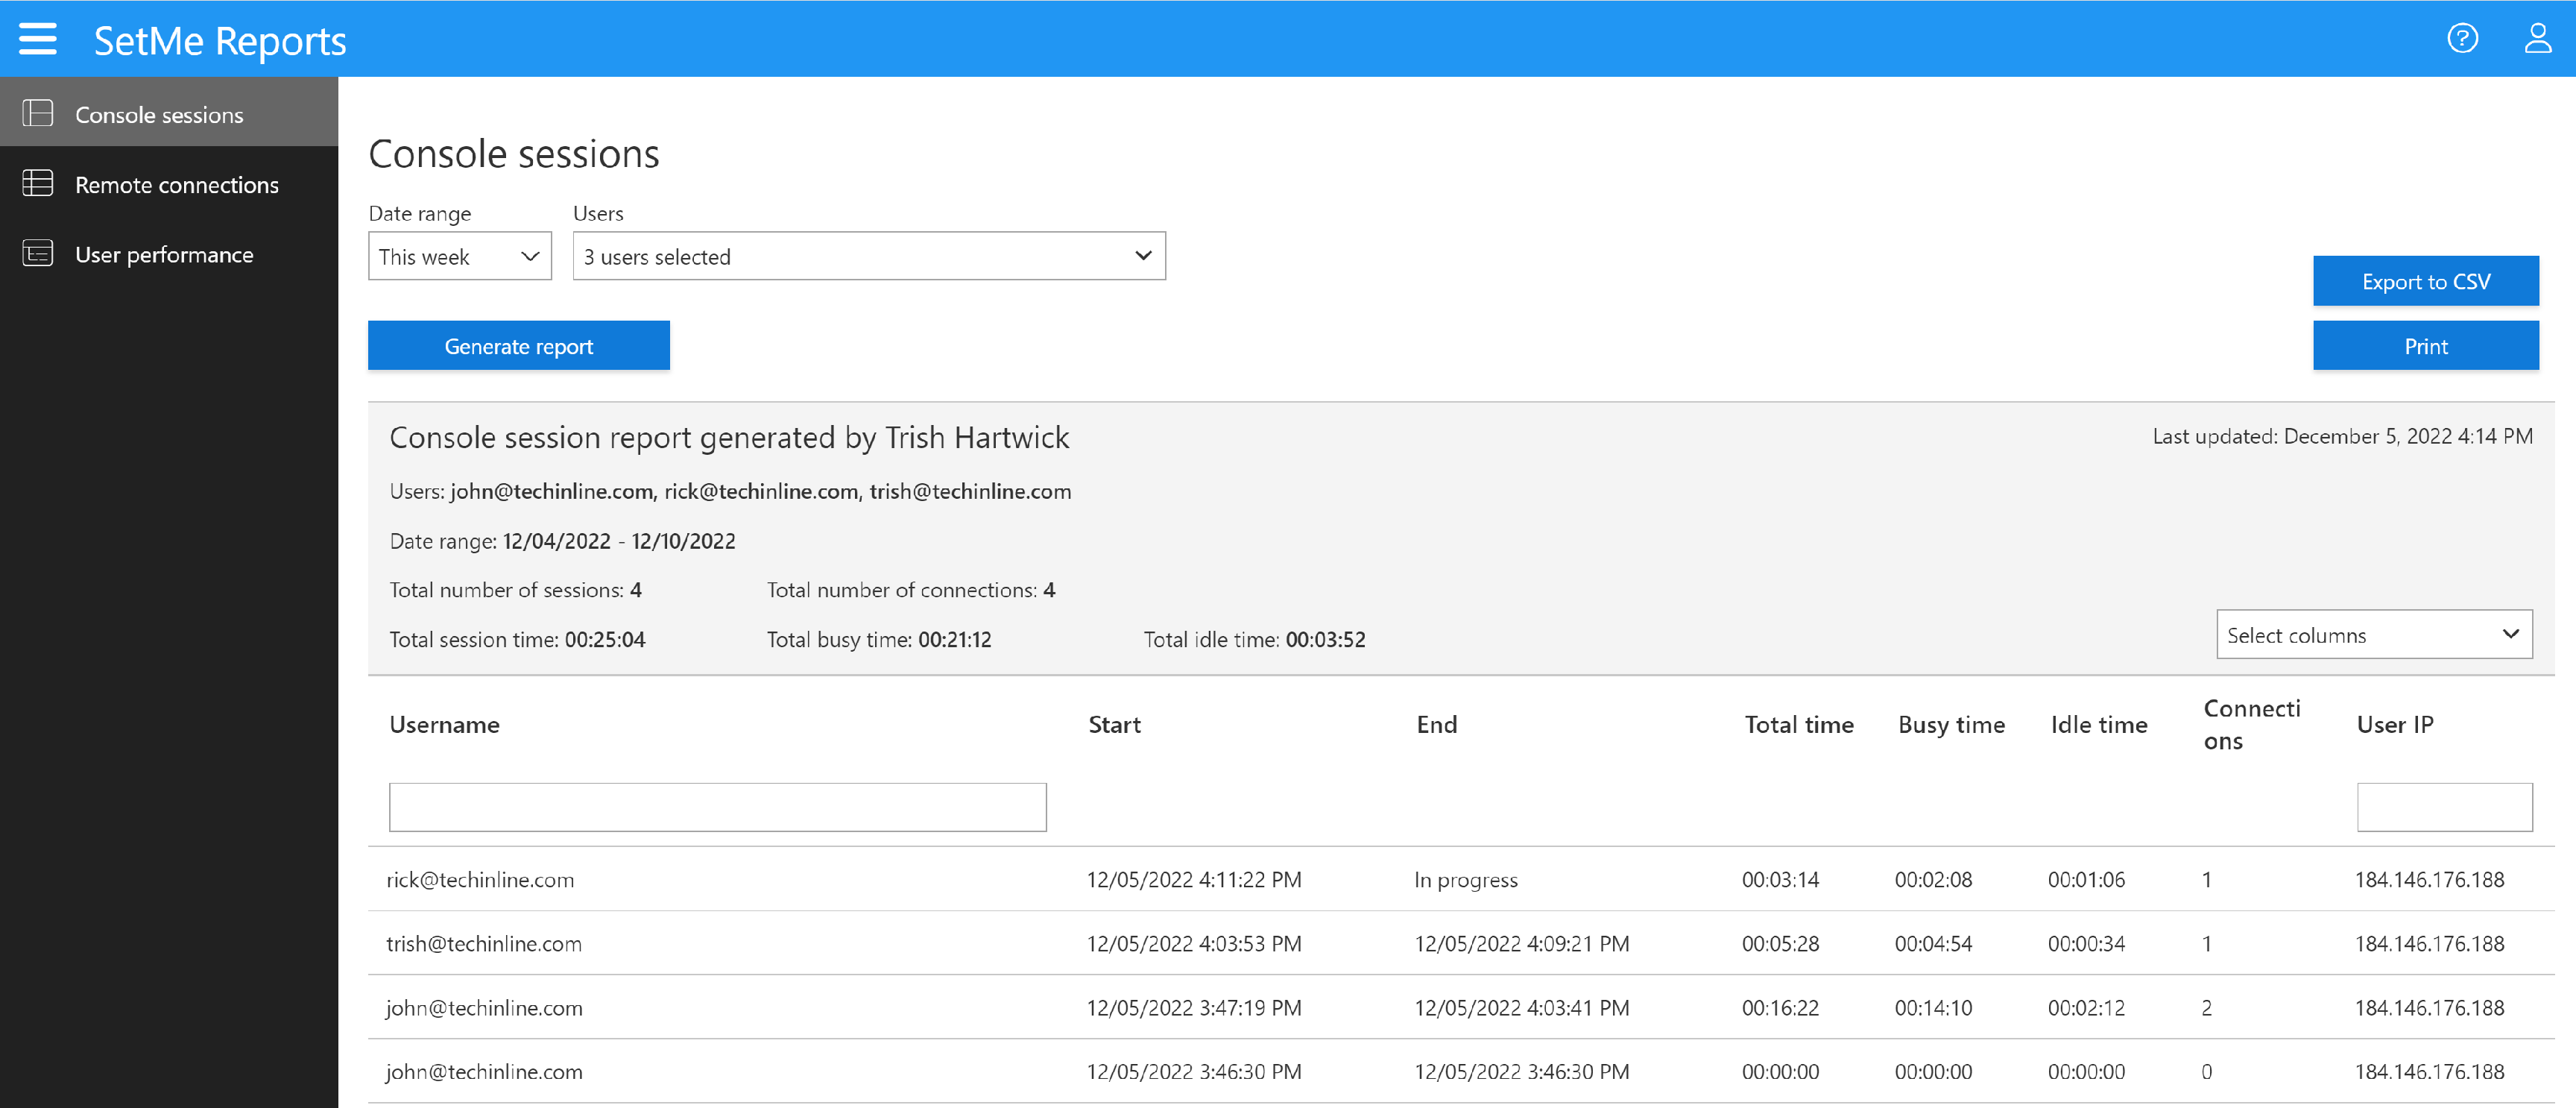
The Summary section of the report displays the following information:
- Users: email addresses of the selected users
- Date range: specified reporting period
- Total number of sessions: total number of Expert Console logins during the specified period
- Total number of connections: total number of remote connections initiated by the selected users
- Total session time: length of time the selected user(s) were logged into the Expert Console
- Total busy time: length of time the selected users were logged into the Expert Console and had active connections
- Total idle time: length of time the selected users were logged into the Expert Console but had no active connections
The Details section of the report displays the following information:
- Username: the user's login email
- Full name: the user's full name (optional, can be selected manually from the drop-down list)
- Start time: the exact login time
- End time: the exact logout time
- Total time: total length of time the user was logged into the Expert Console
- Busy time: length of time a user is logged into the Expert Console and has active connections
- Idle time: length of time a user is logged in to the Expert Console but has no active connections
- Connections: number of remote connections conducted by the user during each console login session
- User IP: the user's IP address
Remote session reports
Provide you with detailed information about every single remote session initiated by each user during a specific time period.
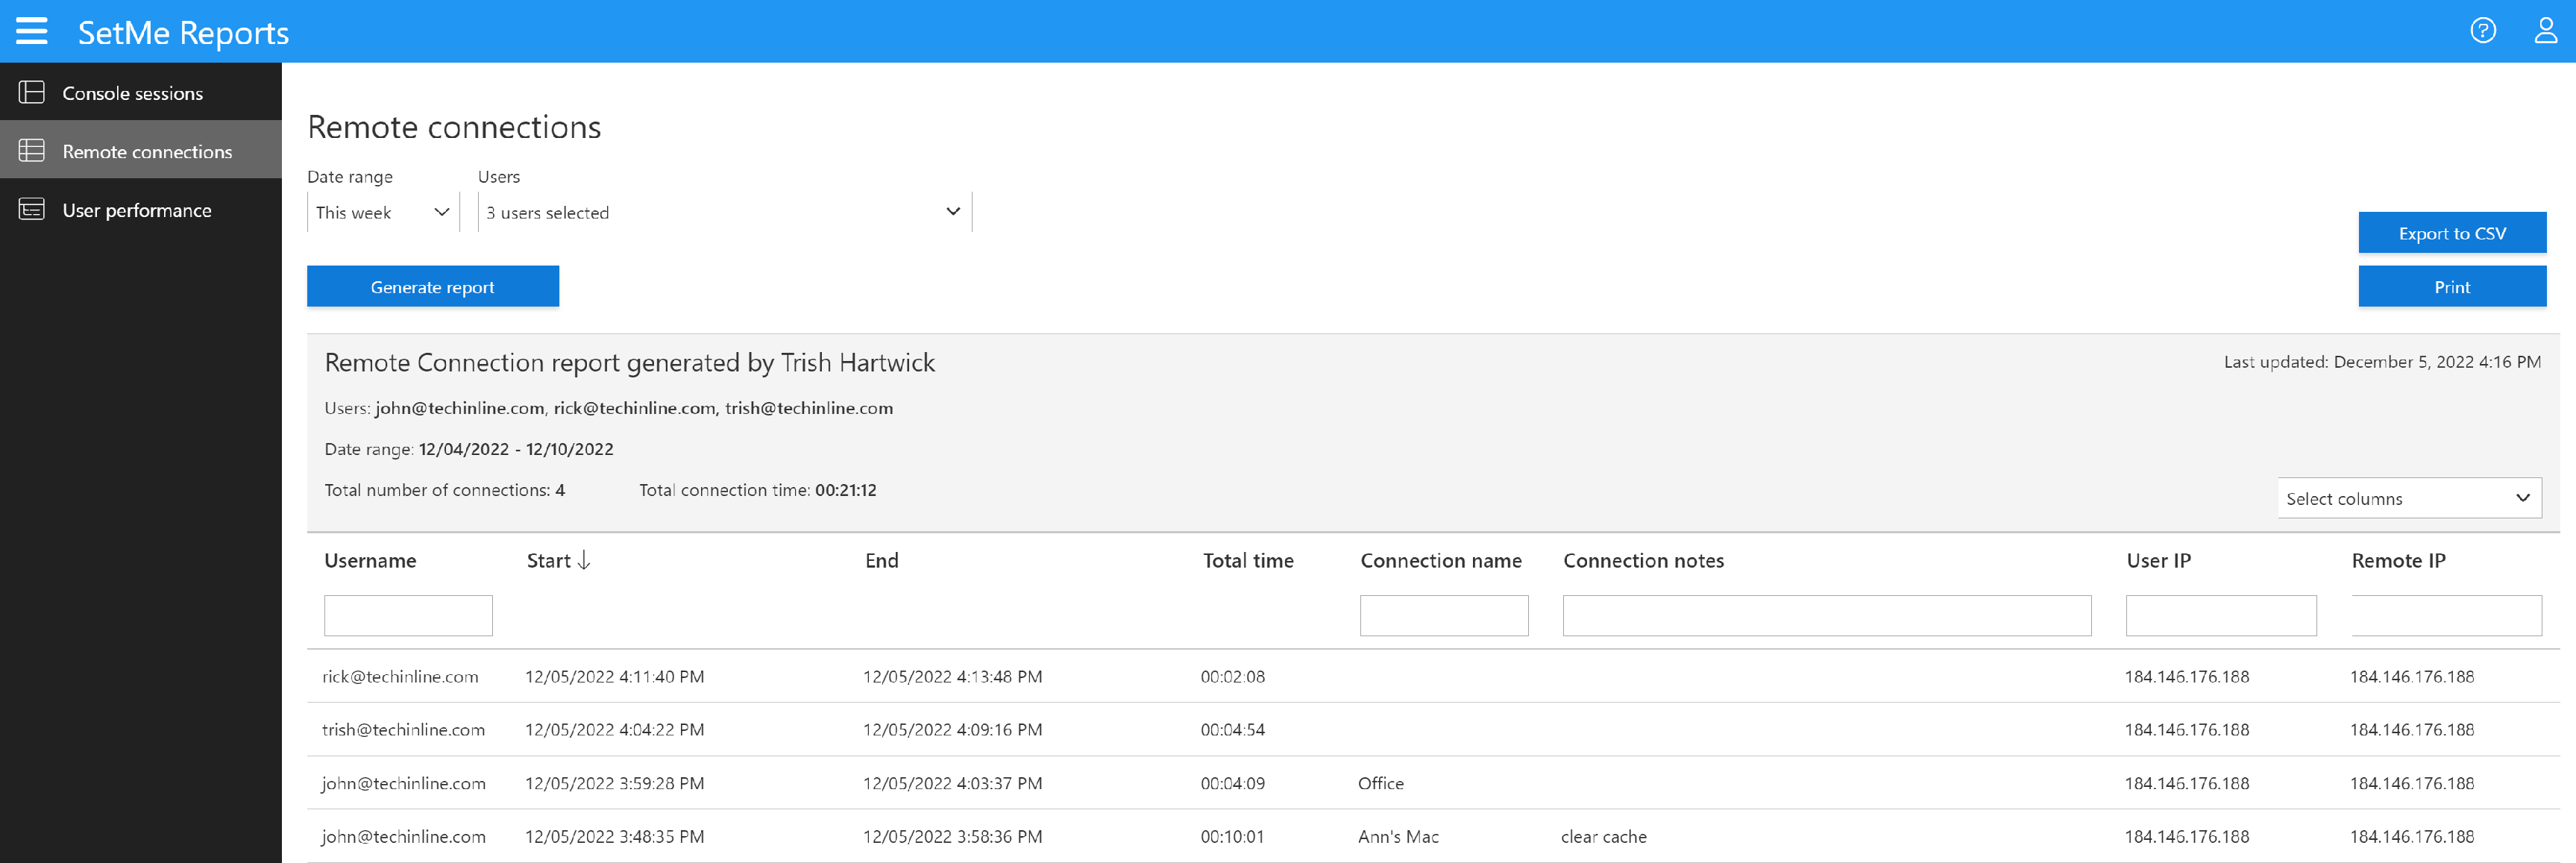
The Summary section displays the following information:
- Users: email addresses of the selected users
- Date range: specified reporting period
- Total number of connections: total number of remote connections initiated by the selected users
- Total connection time: length of time the selected user(s) were connected to remote computers
The Details section of the report displays the following information:
- Username: the user's login email
- Full name: the user's full name (optional, can be selected manually from the drop-down list)
- Start time: the exact time that the remote connection was started
- End time: the exact time that the remote connection was ended
- Total time: the duration of the remote connection
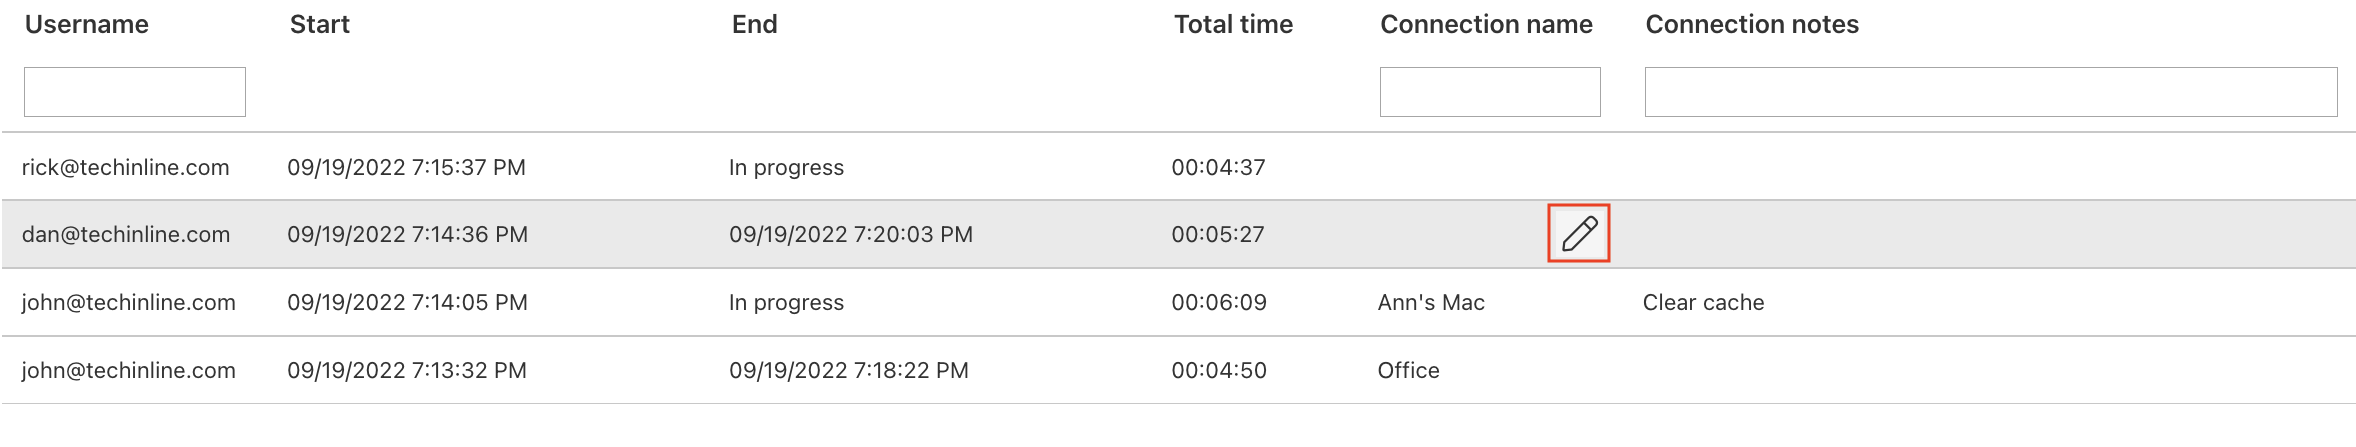
- Connection name: the connection name as specified at the start of, during or after the remote connection
- Connection notes: any notes that were entered during or after the remote connection
- User IP: the user's IP address
- Remote IP: the remote computer's IP address
- Client ID: a unique six-digit ID used to initiate the remote connection (optional, can be selected manually from the drop-down list)
If you are on the SetMe Solo plan, you can only generate reports for your own console logins and remote sessions. User performance reports are unavailable under the Solo plan.
User performance reports
Allow you to review and analyze your team's overall performance during a specific time period.
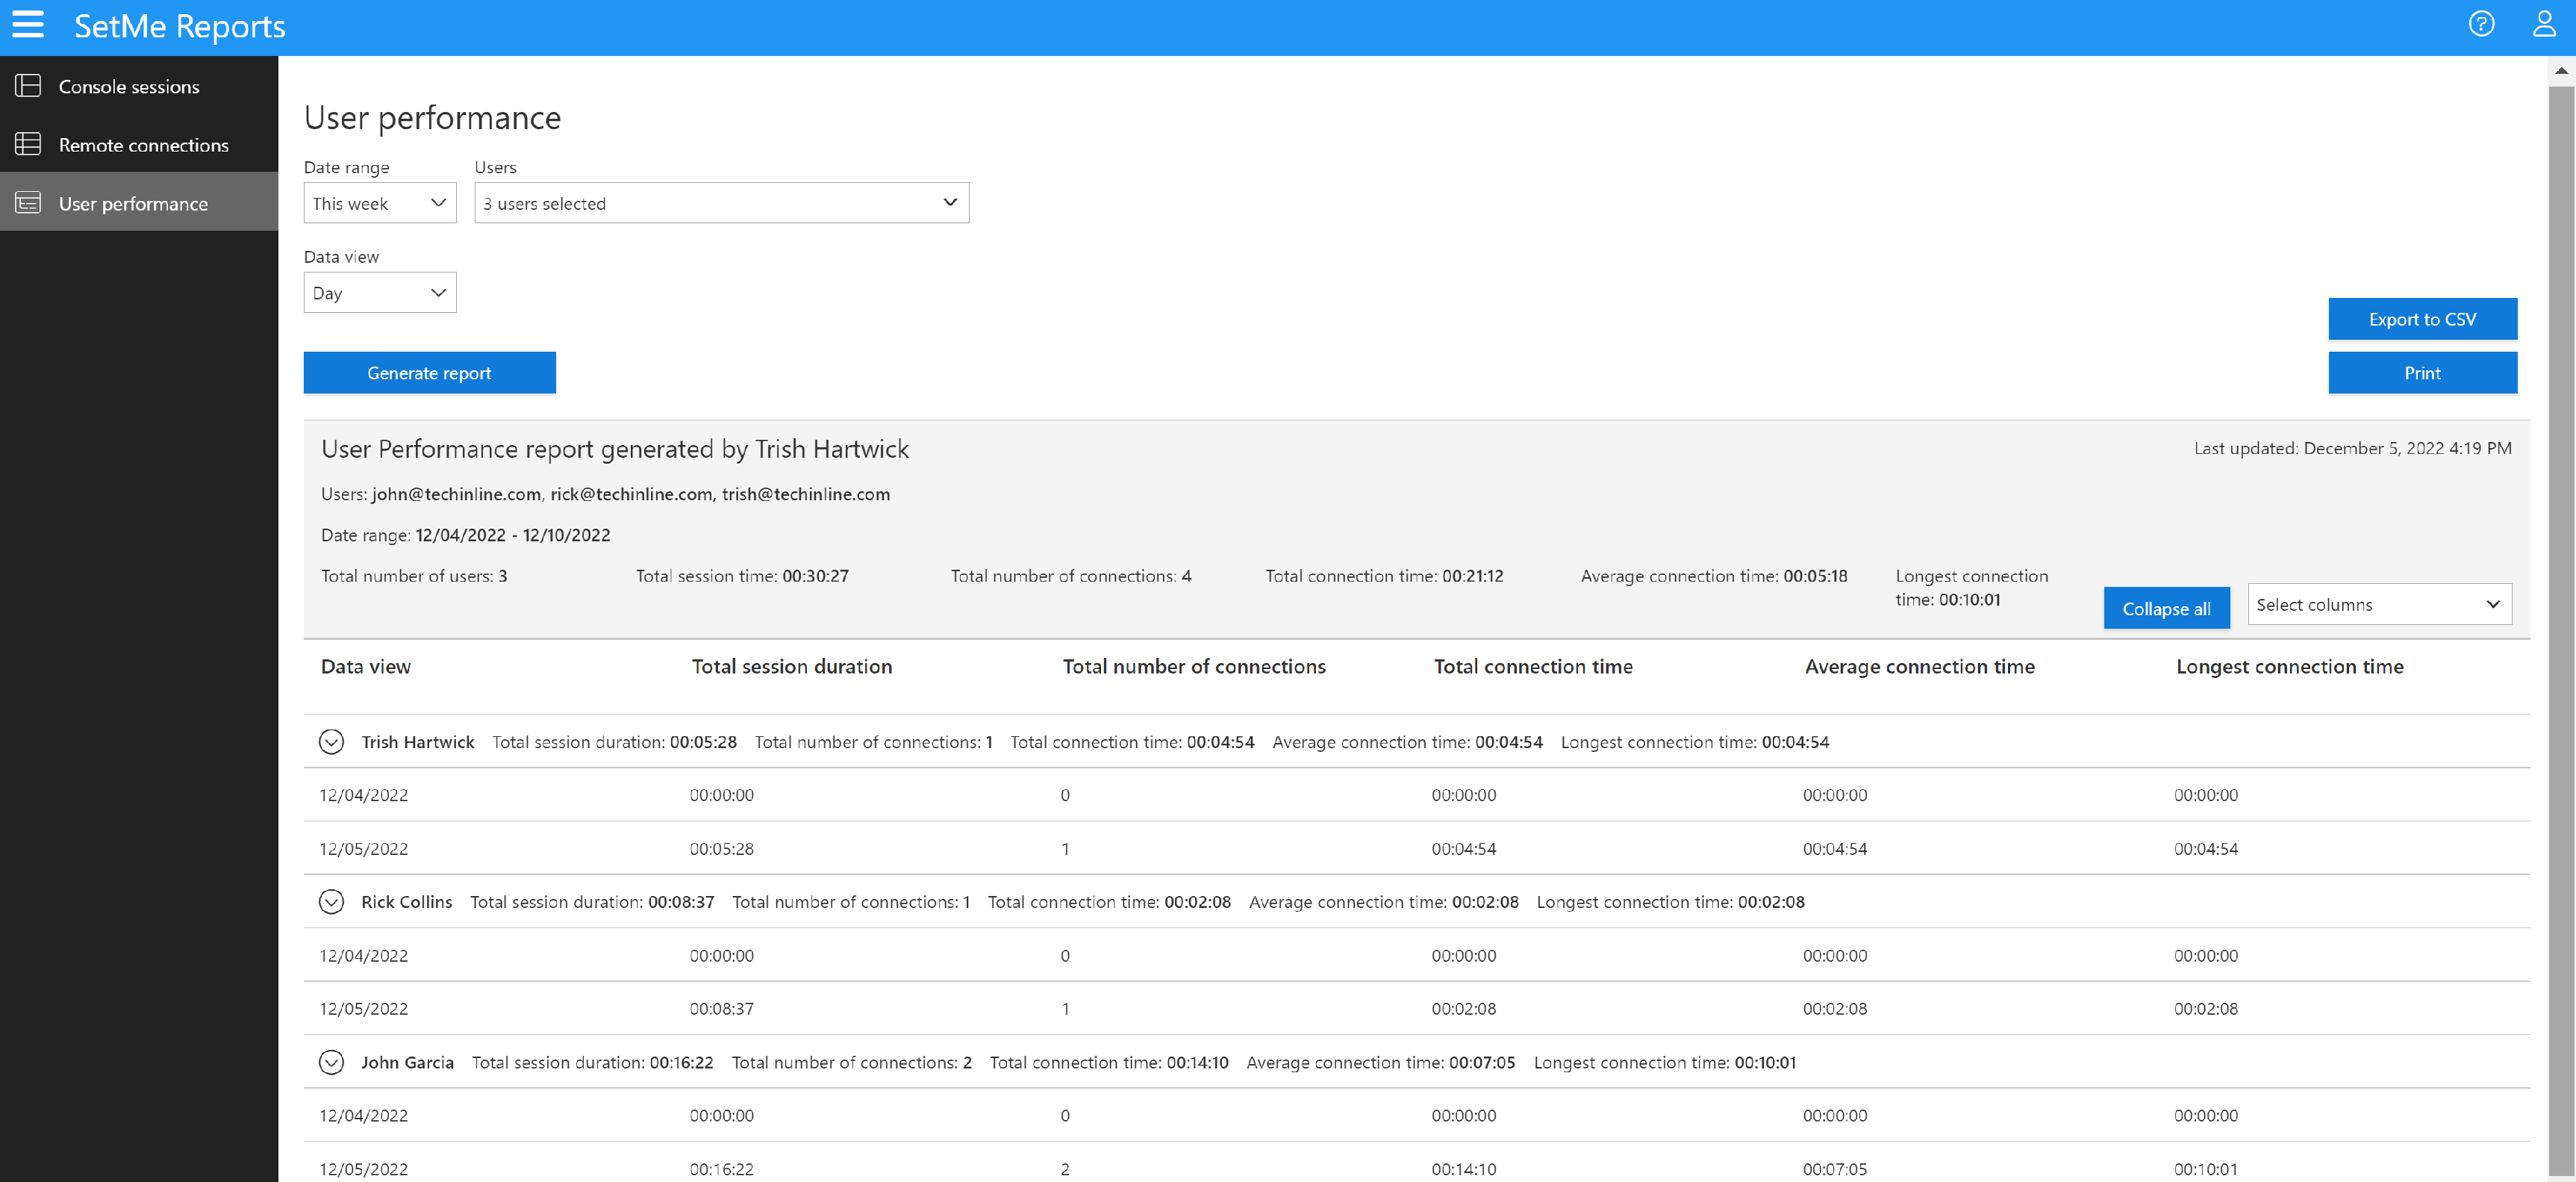
In the User performance report, the Summary section displays the following information:
- Users: email addresses of the selected users
- Date range: specified reporting period
- Total number of users: total number of the selected users
- Total number of connections: total number of remote connections initiated by the selected users
- Total session time: length of time the selected users were logged into the Expert Console
- Average connection time: the average connection duration for all selected users
- Longest connection time: the length of the longest remote connection
The Details section of the report displays the following information:
- Data view: breaks the data output for each user by day, week or month
- Total session duration: length of time the selected user was logged into the Expert Console
- Total number of connections: total number of connections initiated by each user
- Total connection time: length of time each user was connected to remote computers
- Average connection time: the average connection time per user
- Longest connection time: the length of the longest remote connection per user